During the everyday operation of your vending business do you ever check to see if you are making money at an individual account? Is it doing what you thought it would do? Is it worth keeping? You can’t just look at sales and think that everything is good.
I’m going to share an easy way to look at any account to see if it’s making money by using a simple Profit & Loss (P&L) Formula. Once you obtain all the percentages and costs needed to insert into the form you should be able to check any account, large or small, to see if it’s profitable.
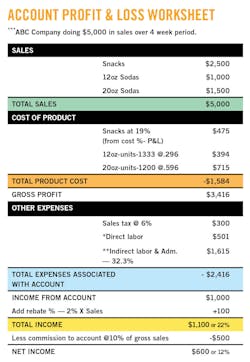
In the example form above, the imaginary account is ABC Company providing sales of $65,000 per year with one snack and two soda machines, one selling 12 ounce and the other 20 ounce sodas. I used the same format to check all of my accounts, even those doing over one hundred thousand dollars a year in sales. The form should be updated monthly to reflect the different percentages and costs needed to apply to the P&L formula. Being able to easily look at the small accounts is what provides the best information. Was the account profitable? If not, how can we make it profitable? Can we ask to lower the commission, and/or raise prices? And if those solutions wouldn’t work, do we stay or do we go?
Notes about Product & Loss chart
*Direct labor
For direct labor we took the route’s total sales of $7,000 per week and the driver’s salary of $700 per week. Account ABC Co. generates $1,250 per week ($5,000÷4) of the total $7,000 or 17.9 percent. Now multiply the $700 weekly salary by 17.9 percent which equals $125.30 per week attributable to this account. Multiply $125.30 by four weeks and it is $501.20 — used on the P&L worksheet.
**Indirect labor & operating expenses
All the money used to pay for support staff and operating expenses needs to come from each account. This amount needs to be applied on a percentage basis to each account’s P&L. From the company P&L remove the percentage associated with route driver wages and add the percentages of the other wages such as administrative, maintenance & repair, warehouse, supervisory, payroll taxes, health benefits, etc. — we used 17.5 percent. Now do the same for operating expenses such as money pick-up service, rent, communications, vehicle expenses, office supplies, etc. — we used 14.8 percent. Add these two numbers to get 32.3 percent. This is the percentage that will be applied to each account to obtain the costs attributable to that account to help run the company.
***Use a four-week period to check on the accounts so that every time a P&L is done, it is using the same length of time. Going by month would not give a good read on profitability as some months have more days than others. To figure four-week sales, take the yearly sales and divide by 13.
See more on how to get each number and complete the worksheet by visiting www.vendingmarketwatch.com/12025604
About the Author
Dominic Finelli is a 43-year veteran vending operator in the Washington, D.C. market. He sold his vending company in 2011. Finelli can be reached at [email protected].

Dominic Finelli
Dominic Finelli is 43-year veteran vending operator in the Washington D.C market. Along with his partner/brother-in-law, John Sartori, he helped grow a family start-up, Custom Vending, to 30 routes. Finelli earned a degree in accounting from Benjamin Franklin University, was a 3-time recipient of the NAMA Chairman's Legislative Award and the 2004 Operator of the Year. Finelli served 23 years as a director of the MD/DC Vending Association, and 10 years as the president. He sold his vending company in 2011. Finelli can be reached at [email protected].


